Graph Usage in Combating ATO Fraud Risk
Sept 15, 2023
15 min read

Introducing ATO and Graph
Account takeover is a fraud risk in online payments that PayPal takes seriously and works actively to preempt to protect our customers’ money and trust.
At PayPal, use of a real-time graph database — a data structure that describes the relationships between the objects by using an edge to represent a relationship, and a vertex to represent an object — has helped a lot in fighting fraudulent behaviors such as account take over as reviewed in another previous technology post.
There are many clues during online activities to help fight account take over, clues that can be aggregated into Graph and safely used together from multiple perspectives. In the following blog post, we will describe how Graph can be used to combat account take over risks from three perspectives.
Asset Sharing
Assets include account level usage information on the PayPal platform such as IP, address, VID, device ID, etc. Some assets can be used or shared by different PayPal accounts, for example a shipping address may be shared by different users who live in the same household, while some assets can only be unique for each PayPal account.
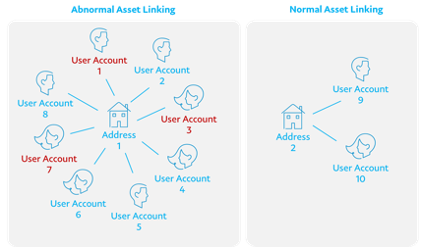
PayPal accounts can be linked to these assets as edges in a graph structure. With this graph structure, one asset-account linking graph is built. Through asset linking graph, we can find out which user/asset is risky based on its sharing records. Asset sharing means that assets are shared by multiple PayPal accounts.
An account’s assets are significant for verifying a customer’s identity. They are generally time-consistent among ordinary accounts and do not change significantly in a short period of time. However, when compared to fraudsters’ taken over accounts, these assets might change frequently within a short period of time, showing inconsistency in account level behaviors when a fraudster logs in or conducts risky activities.
Through Graph, such abnormal activity can be found very easily. By establishing the Asset-Account Graph (shown as Figure 1), we can quickly discover accounts with an abnormal number of asset-sharing, so as to investigate the historical behavior and consistency of these accounts, therefore determine whether the accounts are part of a fraudulent trend or not.

Transaction Patterns
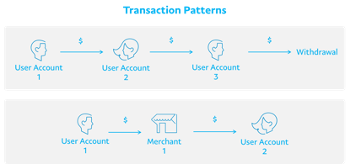
In many cases, people use online payments platforms for more than one transaction at a time. Sometimes users complete multiple transactions in a short period of time, and the recipient is likely to transfer the money to other accounts or withdraw it (shown in Figure 2).

Transaction patterns are valuable in actual business cases for ATO identification. However, if only using relational database information, it requires huge computing resources and lacks convenience due to the data structure not being designed to represent complex relationships. The advantage of using Graph is that the transaction pattern can be easily extracted into the connection status of the Graph, and based on the existing pattern in the data, the suspicious accounts and behaviors involved can be quickly found. For instance, there is a common transaction pattern between two accounts, A and B, that these two accounts repeatedly send money back and forth to each other at least four times during a period, and for convenience it is named as “ABABA” pattern. For each transaction, it is easy to extract its information using a transaction relational dataset. However, if we need to know the panorama of this transaction pattern across a period, the relational dataset must be joint at least four times to complete the data scanning to build the panorama. Therefore, with the help of graph structure data, this process is much easier than only using the traditional relational dataset.
We’ve done some research using graph structural data to discover the opportunity of different transaction patterns. Taking the above ABABA transaction pattern as an example. This pattern frequently appears in ATO-ed accounts, causing millions of fraudulent losses yearly for our company. Only with the help of graph database and structure, can we dive deep into this risky transaction pattern and further react to save the loss.
Graph Features
The graph features are some graph-theoretic features calculated for the topology of the graph. It is difficult to obtain such graph features in ordinary transaction data and asset data. It can be said that the graph features can be calculated and implemented only by relying on the data structure of graph.
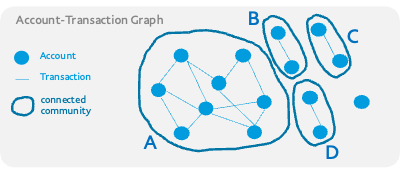
Figure 3 demonstrated an account-transaction graph, with Account as vertices and the transaction relationship between accounts as edges. In the left part of the graph, some accounts are closely linked together while the other accounts distribute relatively scattered in the right part.

One graph feature, connected community, is used to describe the connected sub graph within the original graph. In this graph, there are four connected community — A,B,C and D — for at least two vertices are connected to generate a sub graph. Noticeably, connected community A has much more vertices than the others, while B,C and D are structurally alike. This difference between A and the other parts of graph is worth studying.
In fact, this graph feature is helpful for identifying closely connected accounts and their transactional behaviors, thus for further account clustering and anomaly detection. Given an account- transaction graph, the transactional connection between a group of fraudsters might be very different from ordinary accounts. Therefore, there’s huge potential to use graph features like connected community to identify group of graph risky elements (vertices or edges).
The advantage of the graph features is that it can identify which vertices are more important in the whole graph from a global perspective. Alternatively, by using global graph features, quantitative research and properties can be grasped from the obtained graph, to further prevent large scale losses for our customers.
Summary
To summarize, this article showed how to adopt Graph, an abstract data structure, for risk identification and anomaly discovery for ATO fraud risk.
At PayPal, powerful graph data processing capabilities and front-end tools and platforms have enabled analysts and data scientists to prevent and analyze risk loss more effectively and comprehensively, to protect every customer’s account and transaction security, providing a comfortable and safe transaction environment for every customer.
