All Dashboards
Last updated: Aug 15th, 6:06am
- Mobile Summary Dashboard
- Mobile Spend Dashboard
- Mobile Transactions Dashboard
- User Enrollment Dashboard
- User Activity Dashboard
- Offer Usage Dashboard
- Fuel Preauthorization Dashboard
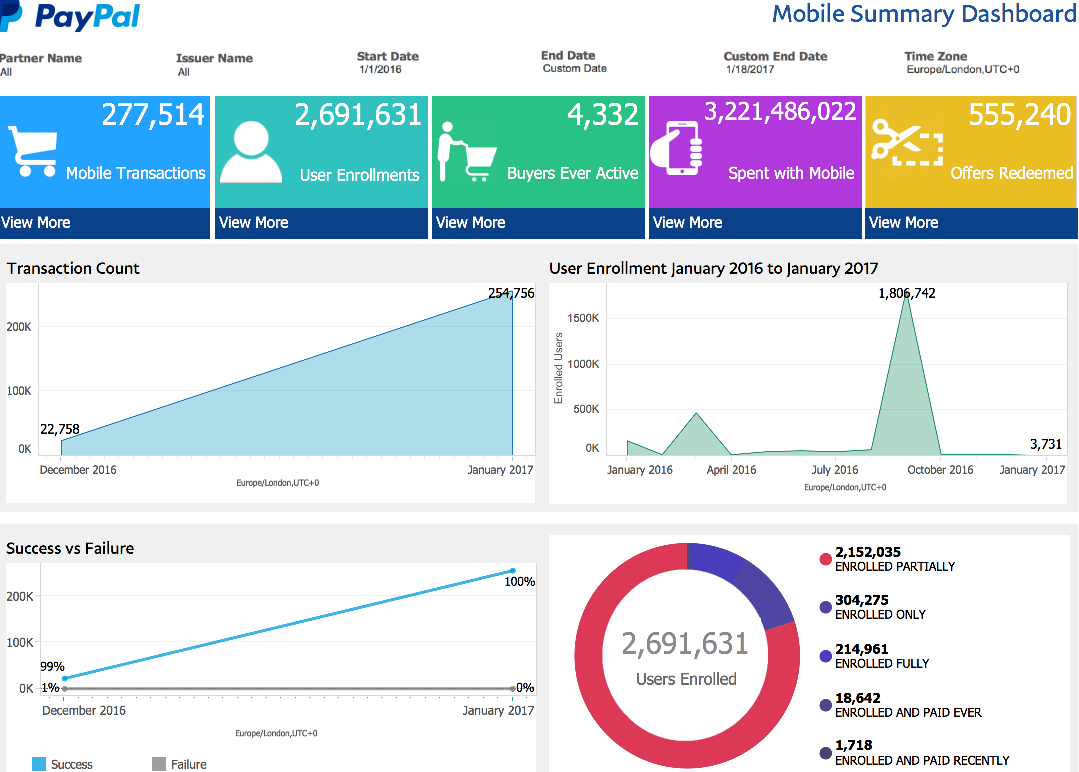
Mobile Summary Dashboard
Provides an overarching snapshot of mobile app activity and overall mobile wallet usage.
Update frequency: Daily
Key features
- Top Key Performance Indicators (KPIs), including total transaction counts, total enrolled user counts, total buyer counts, total transaction amounts, and total offer redemptions (if applicable).
- Clickable KPI icons that will link to other dashboards, including the Mobile Transactions Dashboard, User Enrollment Dashboard, User Activity Dashboard, Mobile Spend Dashboard, and Offer Usage Dashboard.
- Depicts user enrollments and transactions over time.
- Compares successful vs. failed transaction counts.
- Displays relative proportions of various enrollment statuses.
- Displays local timestamps using the
Time Zonefilter.
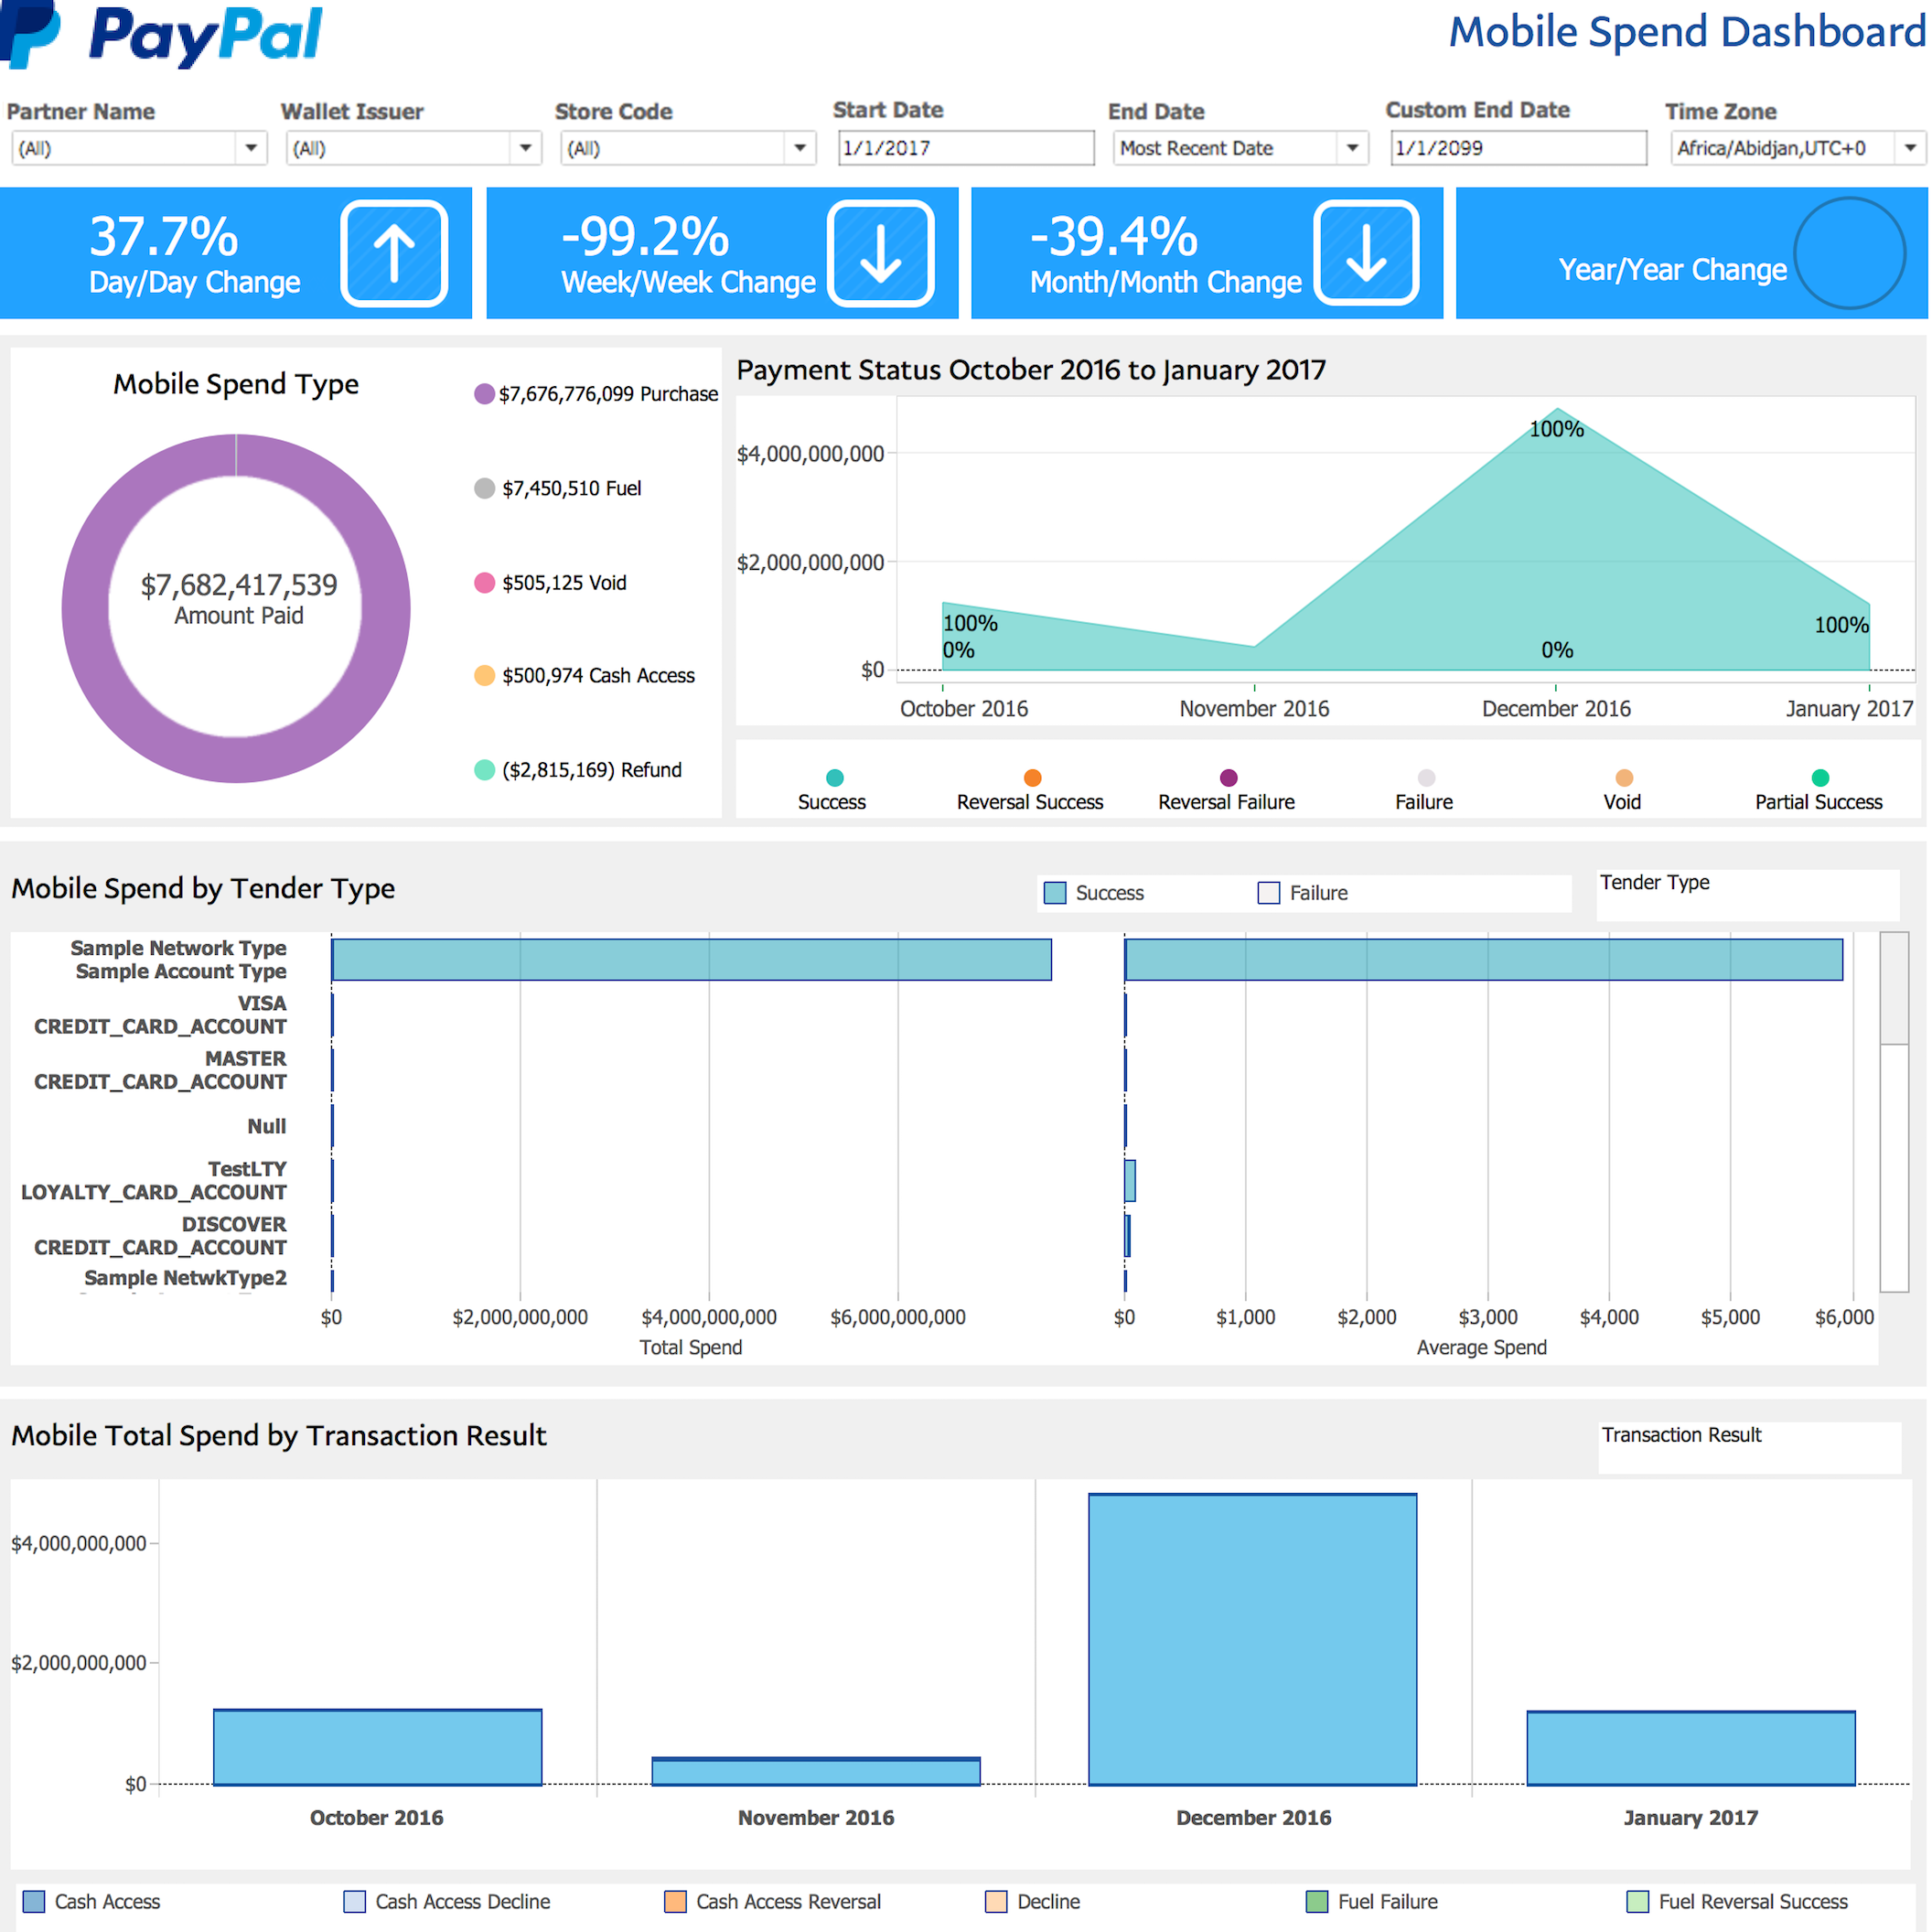
Mobile Spend Dashboard
Provides a nuanced breakdown of transaction behavior, with a main focus on Transaction Amount.
Update Frequency: Hourly
Key features
- Filters data by criteria such as
Wallet Issuer,Date Range,Location,Tender Type,Store Code,Timezone, andTransaction Result. - Depicts change in percentage of mobile transaction amounts by day, week, month, and year.
- Displays mobile transaction spend distributions by transaction type (
Purchase,Fuel,Void,Cash Access, orRefund). - Depicts transaction amount over time by payment status (
Success,Failure,Partial Success,Reversal Success,Reversal Failure, andVoid). - Breaks down total transaction amount and average transaction by a selected field, such as
Wallet Issuer,Acceptance Partner,Location, orTender Type. - Mobile transactions broken down by
successandfailure. - Chronological bar graph of total transaction amounts over time. Ability to compare values of a selected field such as
Wallet Issuer,Acceptance Partner,Location,Tender Type, orTransaction Result. - Displays local timestamps using the
Time Zonefilter (not shown in this sample).
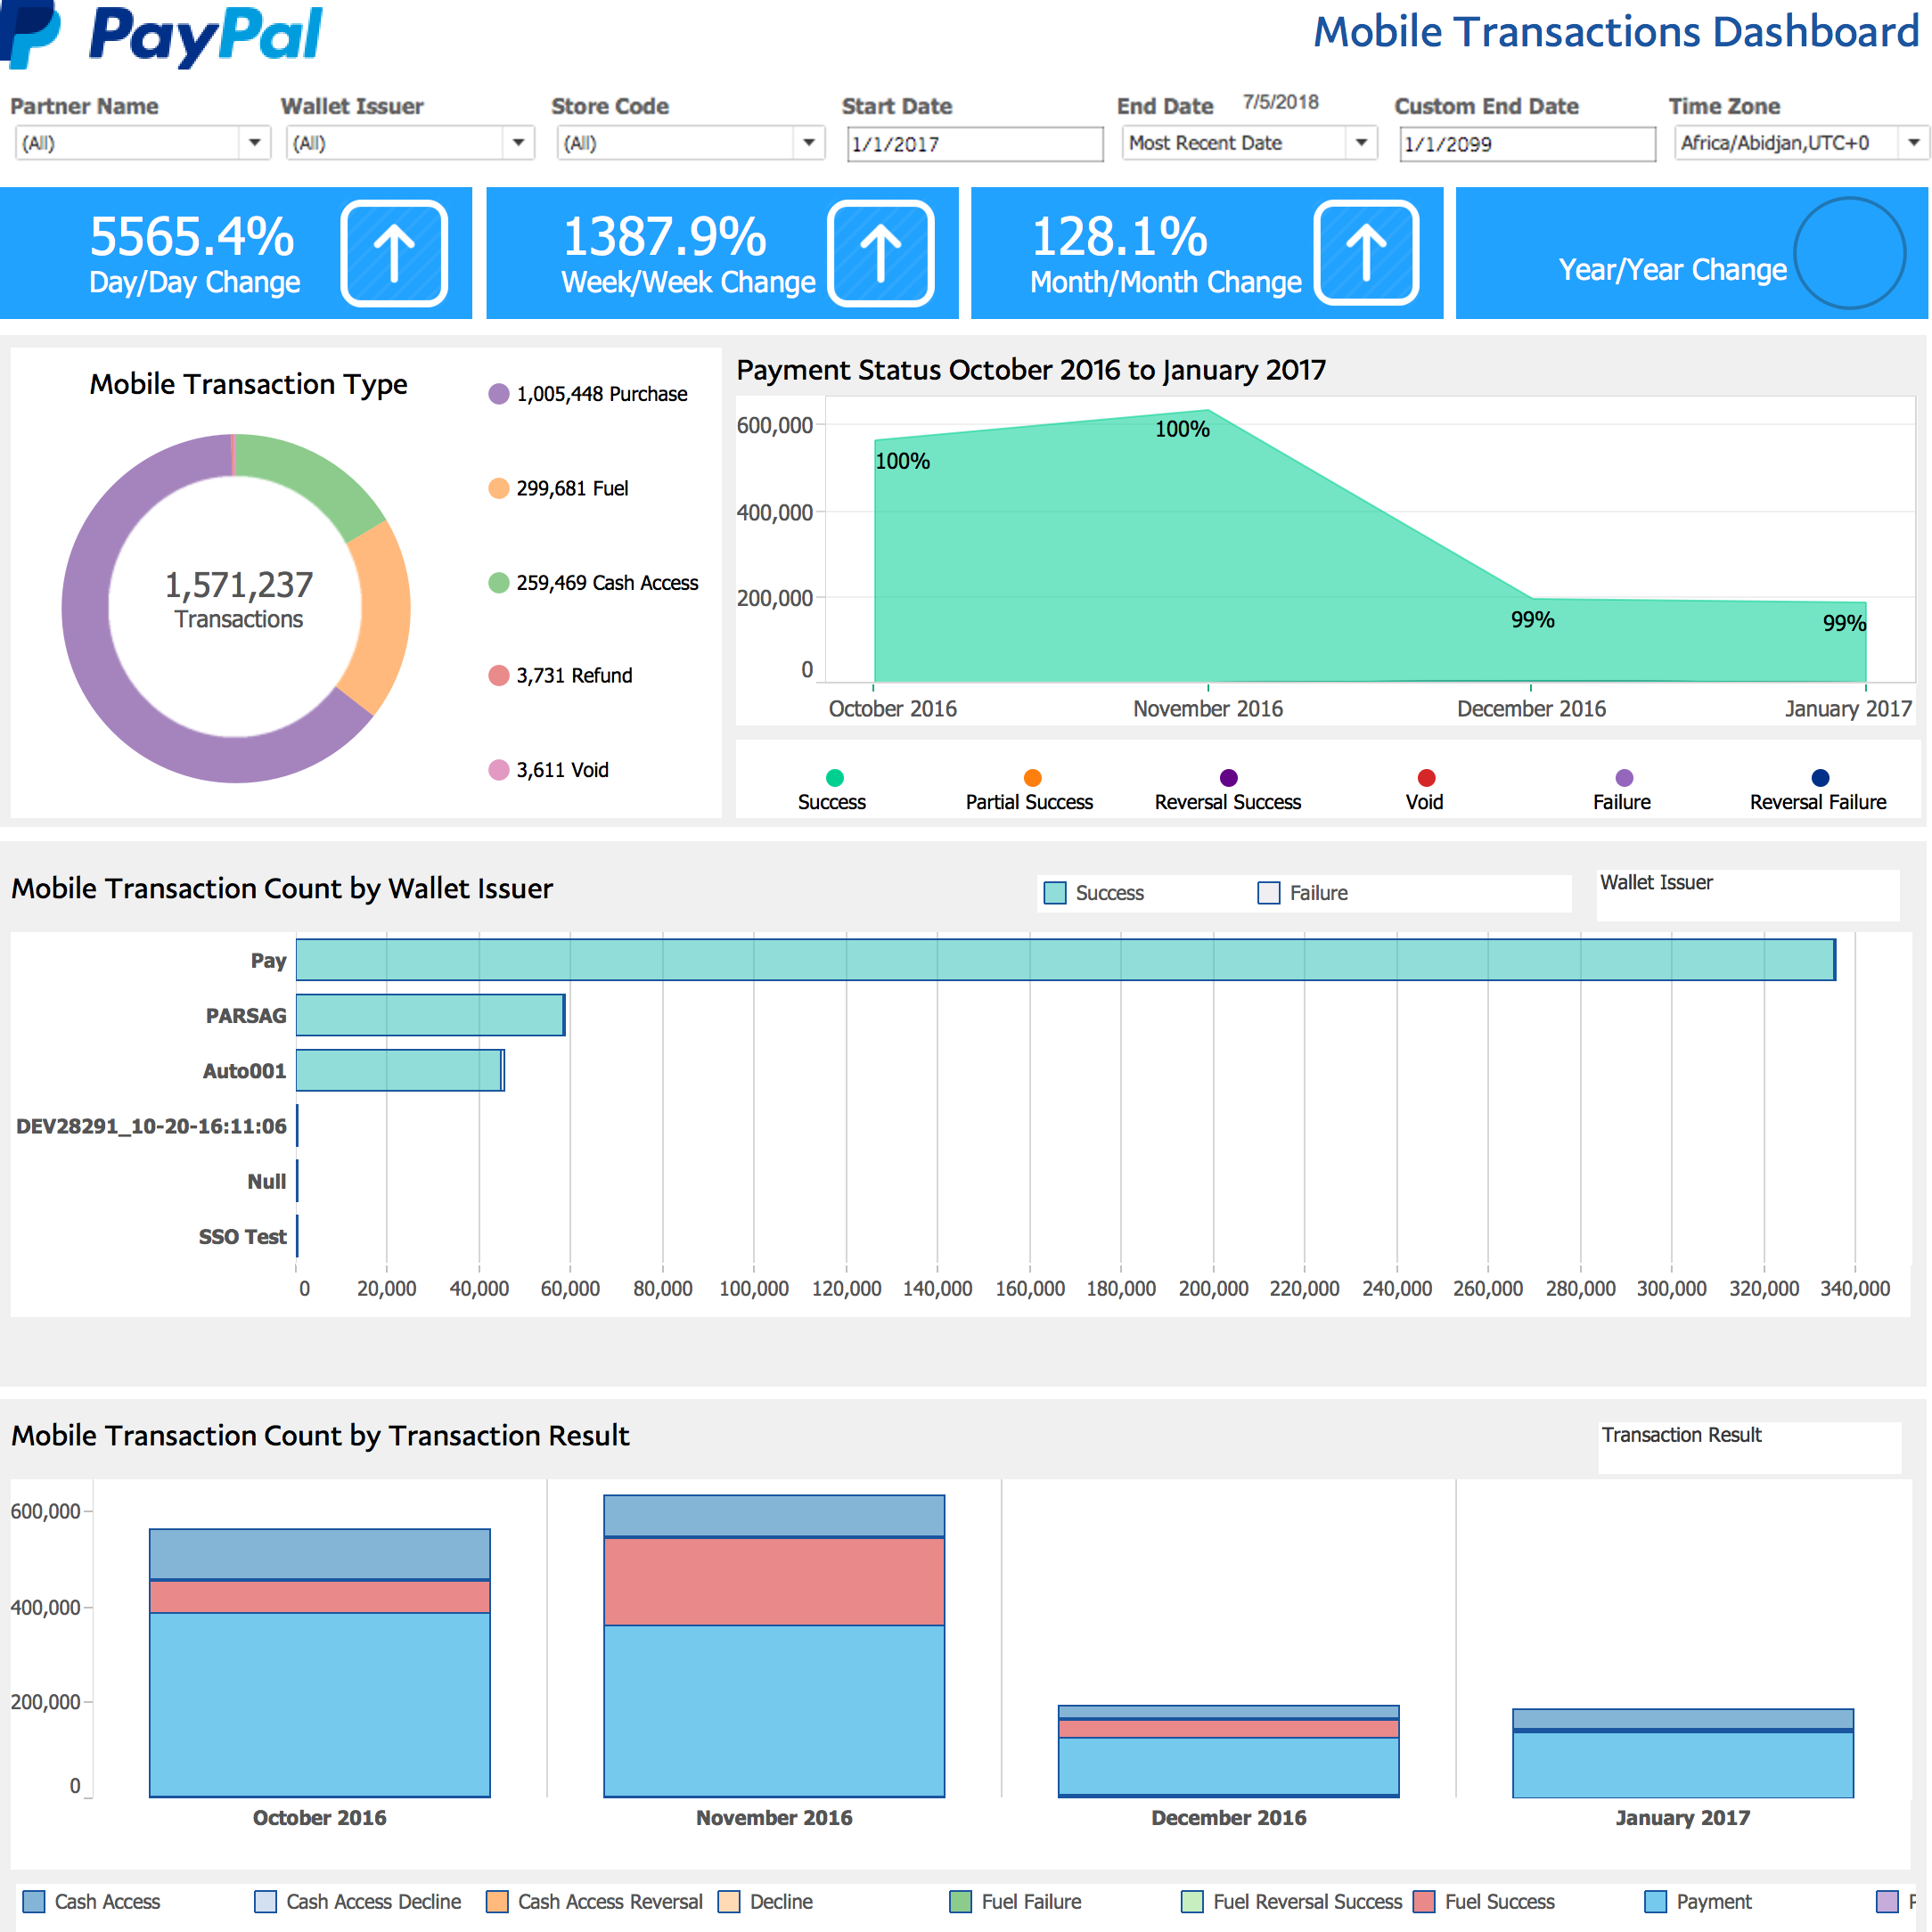
Mobile Transactions Dashboard
Provides a nuanced breakdown of transaction behavior with a focus on Transaction Count.
Update Frequency: Hourly
Key features
- Filters data by criteria such as
Wallet Issuer,Date Range,Location,Tender Type,Store Code,Timezone, andTransaction Result. - Depicts changes in percentage of transaction counts by day, week, month, and year.
- Displays relative proportions of multiple transaction types.
- Depicts transaction counts by payment status over time (
Success,Failure,Partial Success,Reversal Success,Reversal Failure, andVoid). - Transaction counts filtered by various criteria, such as
Wallet Issuer,Acceptance Partner,Location, orTender Type. - Transactions broken down by
SuccessandFailure. - Chronological bar graph of transaction counts that illustrate total counts over time. Selecting a color on the chart allows the user to compare various categories of a selected field, such as
Wallet Issuer,Acceptance Partner,Location,Tender Type,Transaction Result, orFailure Reason. - Displays local timestamps using the
Time Zonefilter (not shown in figure).
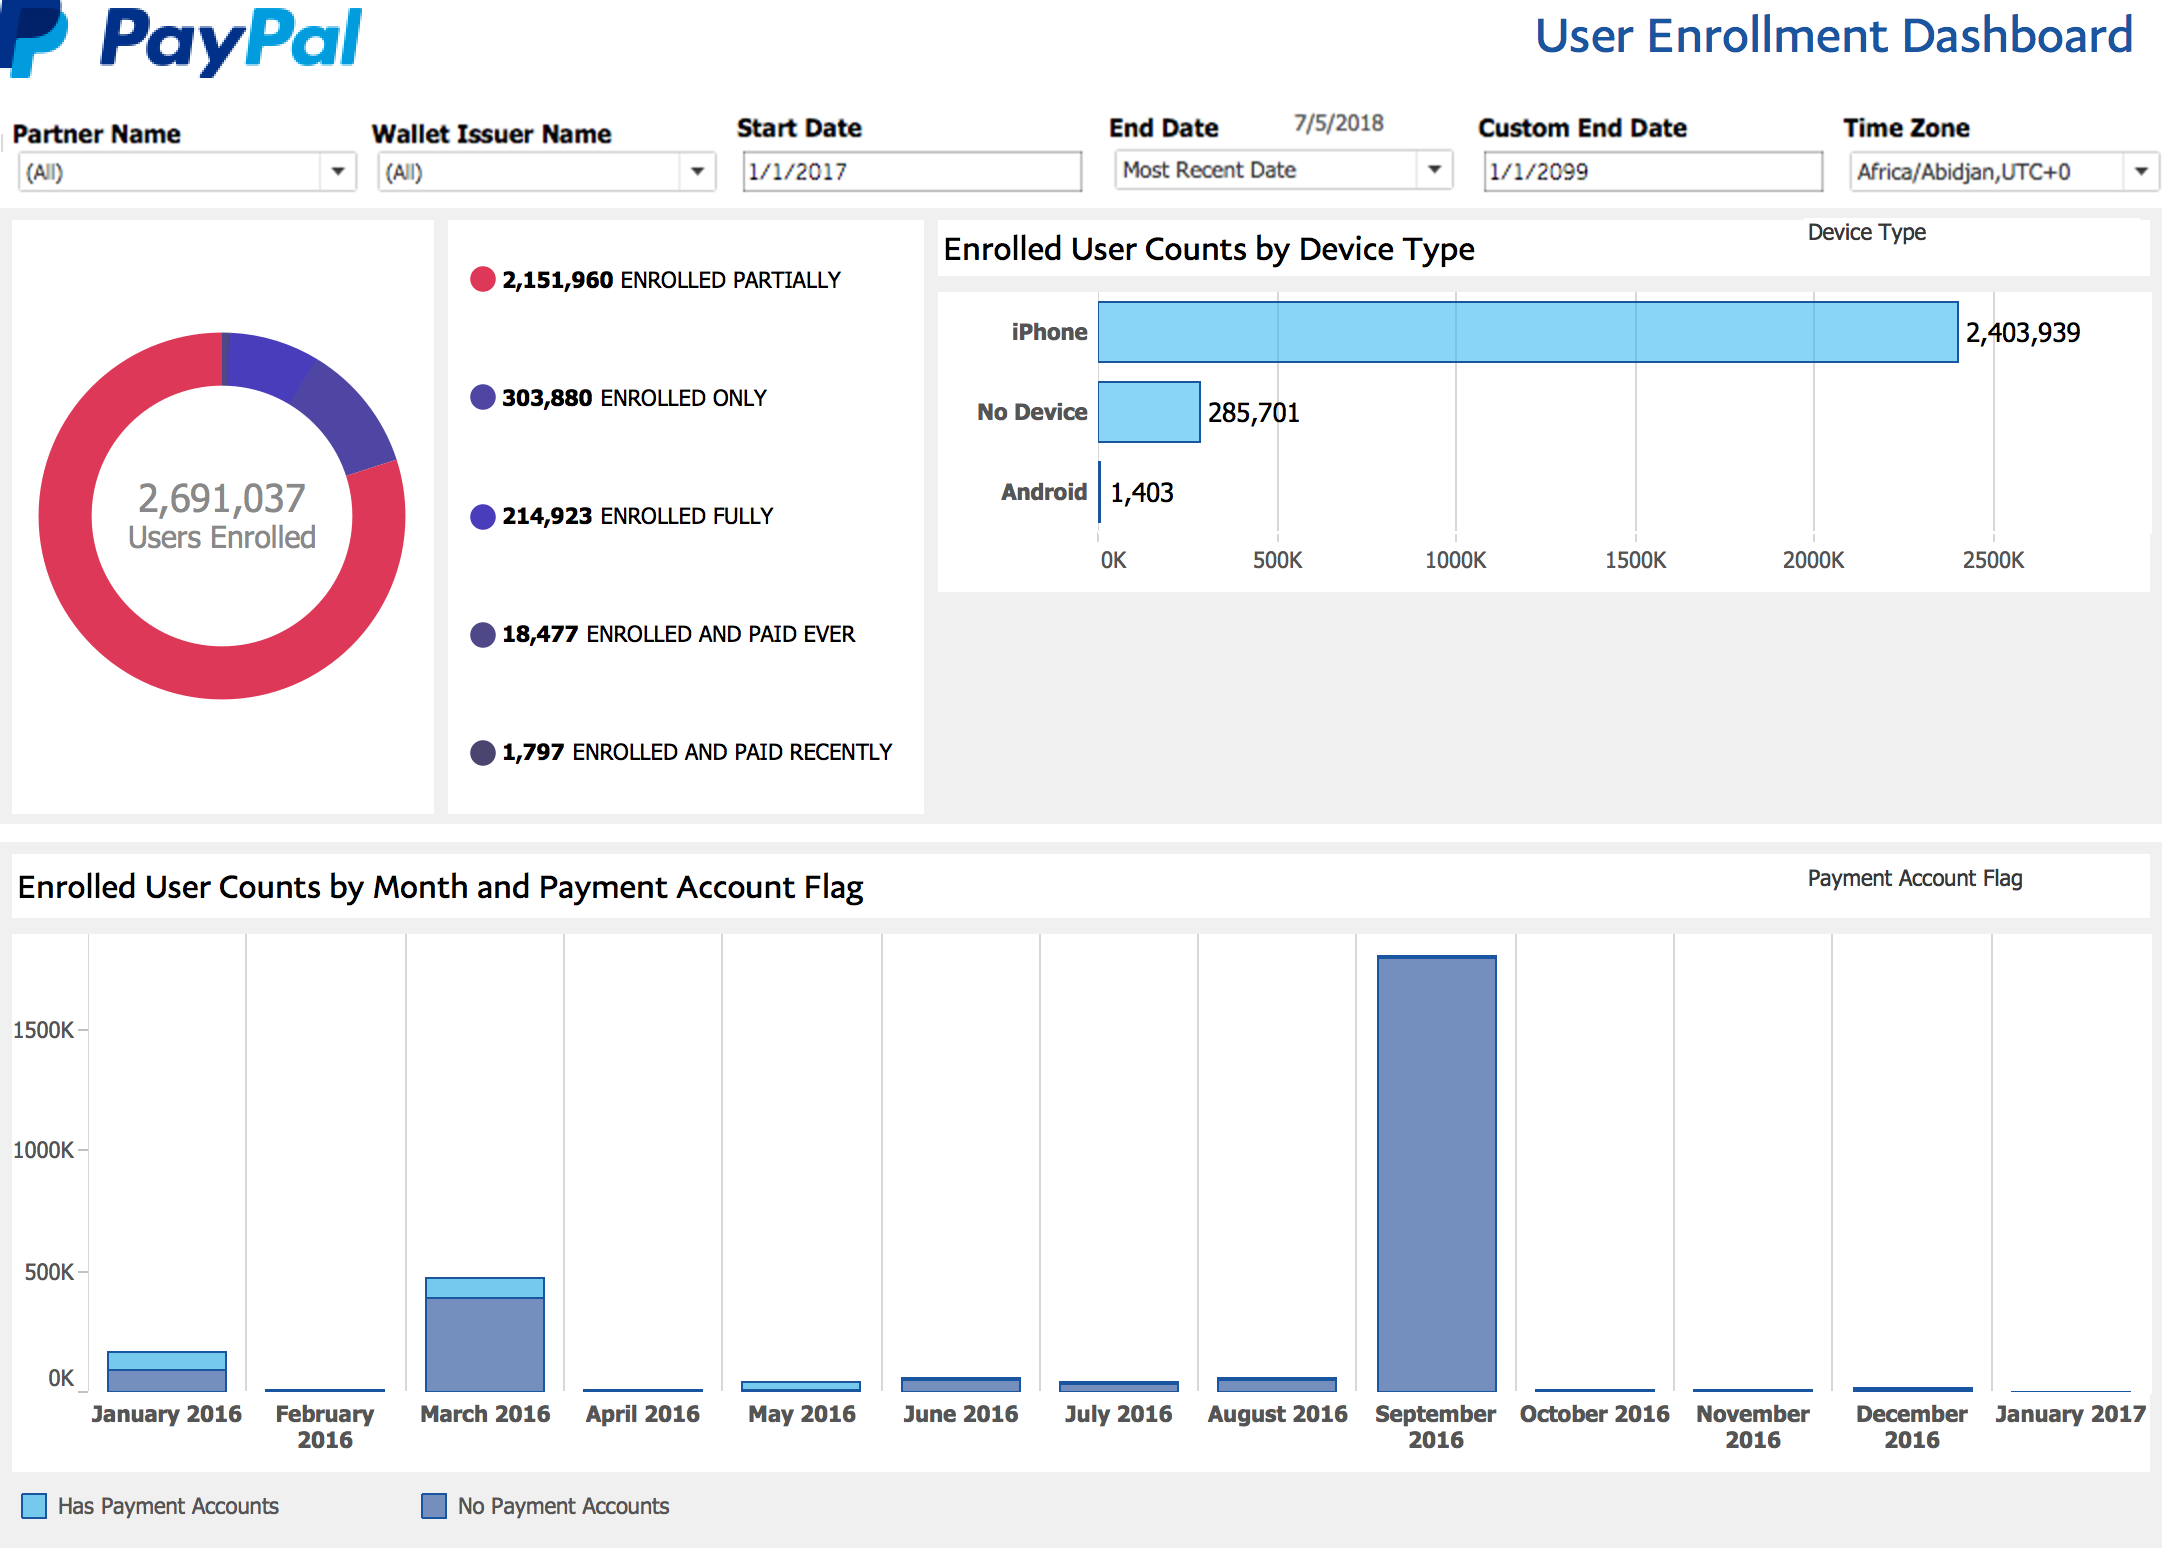
User Enrollment Dashboard
Provides an analysis of the number of enrolled users in a mobile wallet.
Update frequency: Daily
Key features
- Contains information about the status of a user's enrollment:
Enrolled Only- the user has created an account on the customer portal, but does not have an associated device or a verified payment account in the wallet.Enrolled Partially- the user has a registered active device or a verified payment account in the wallet.Enrolled Fully- the user has a registered active device and a verified payment account in the wallet.Enrolled and Paid Ever- the user is fully enrolled (device + payment account) and has had a successful transaction since enrolling.Enrolled and Paid Recently- the user is fully enrolled (device + payment account) and has had a successful transaction in the last 30 days
- Ratios of multiple enrollment statuses illustrated by graphs.
- Breakdown of enrollments by various fields, such as
Wallet Issuer,Device Type, orPayment Account. - Filters data by various criteria, including
Wallet Issuer,Date Range,Device Type, and whether or not the user has a payment account. - Chronological bar graph of user account enrollment over time that allows for comparisons across categories such as
Wallet Issuer,Device Type, and whether or not the user has a payment account. - Displays local timestamps using the
Time Zonefilter.
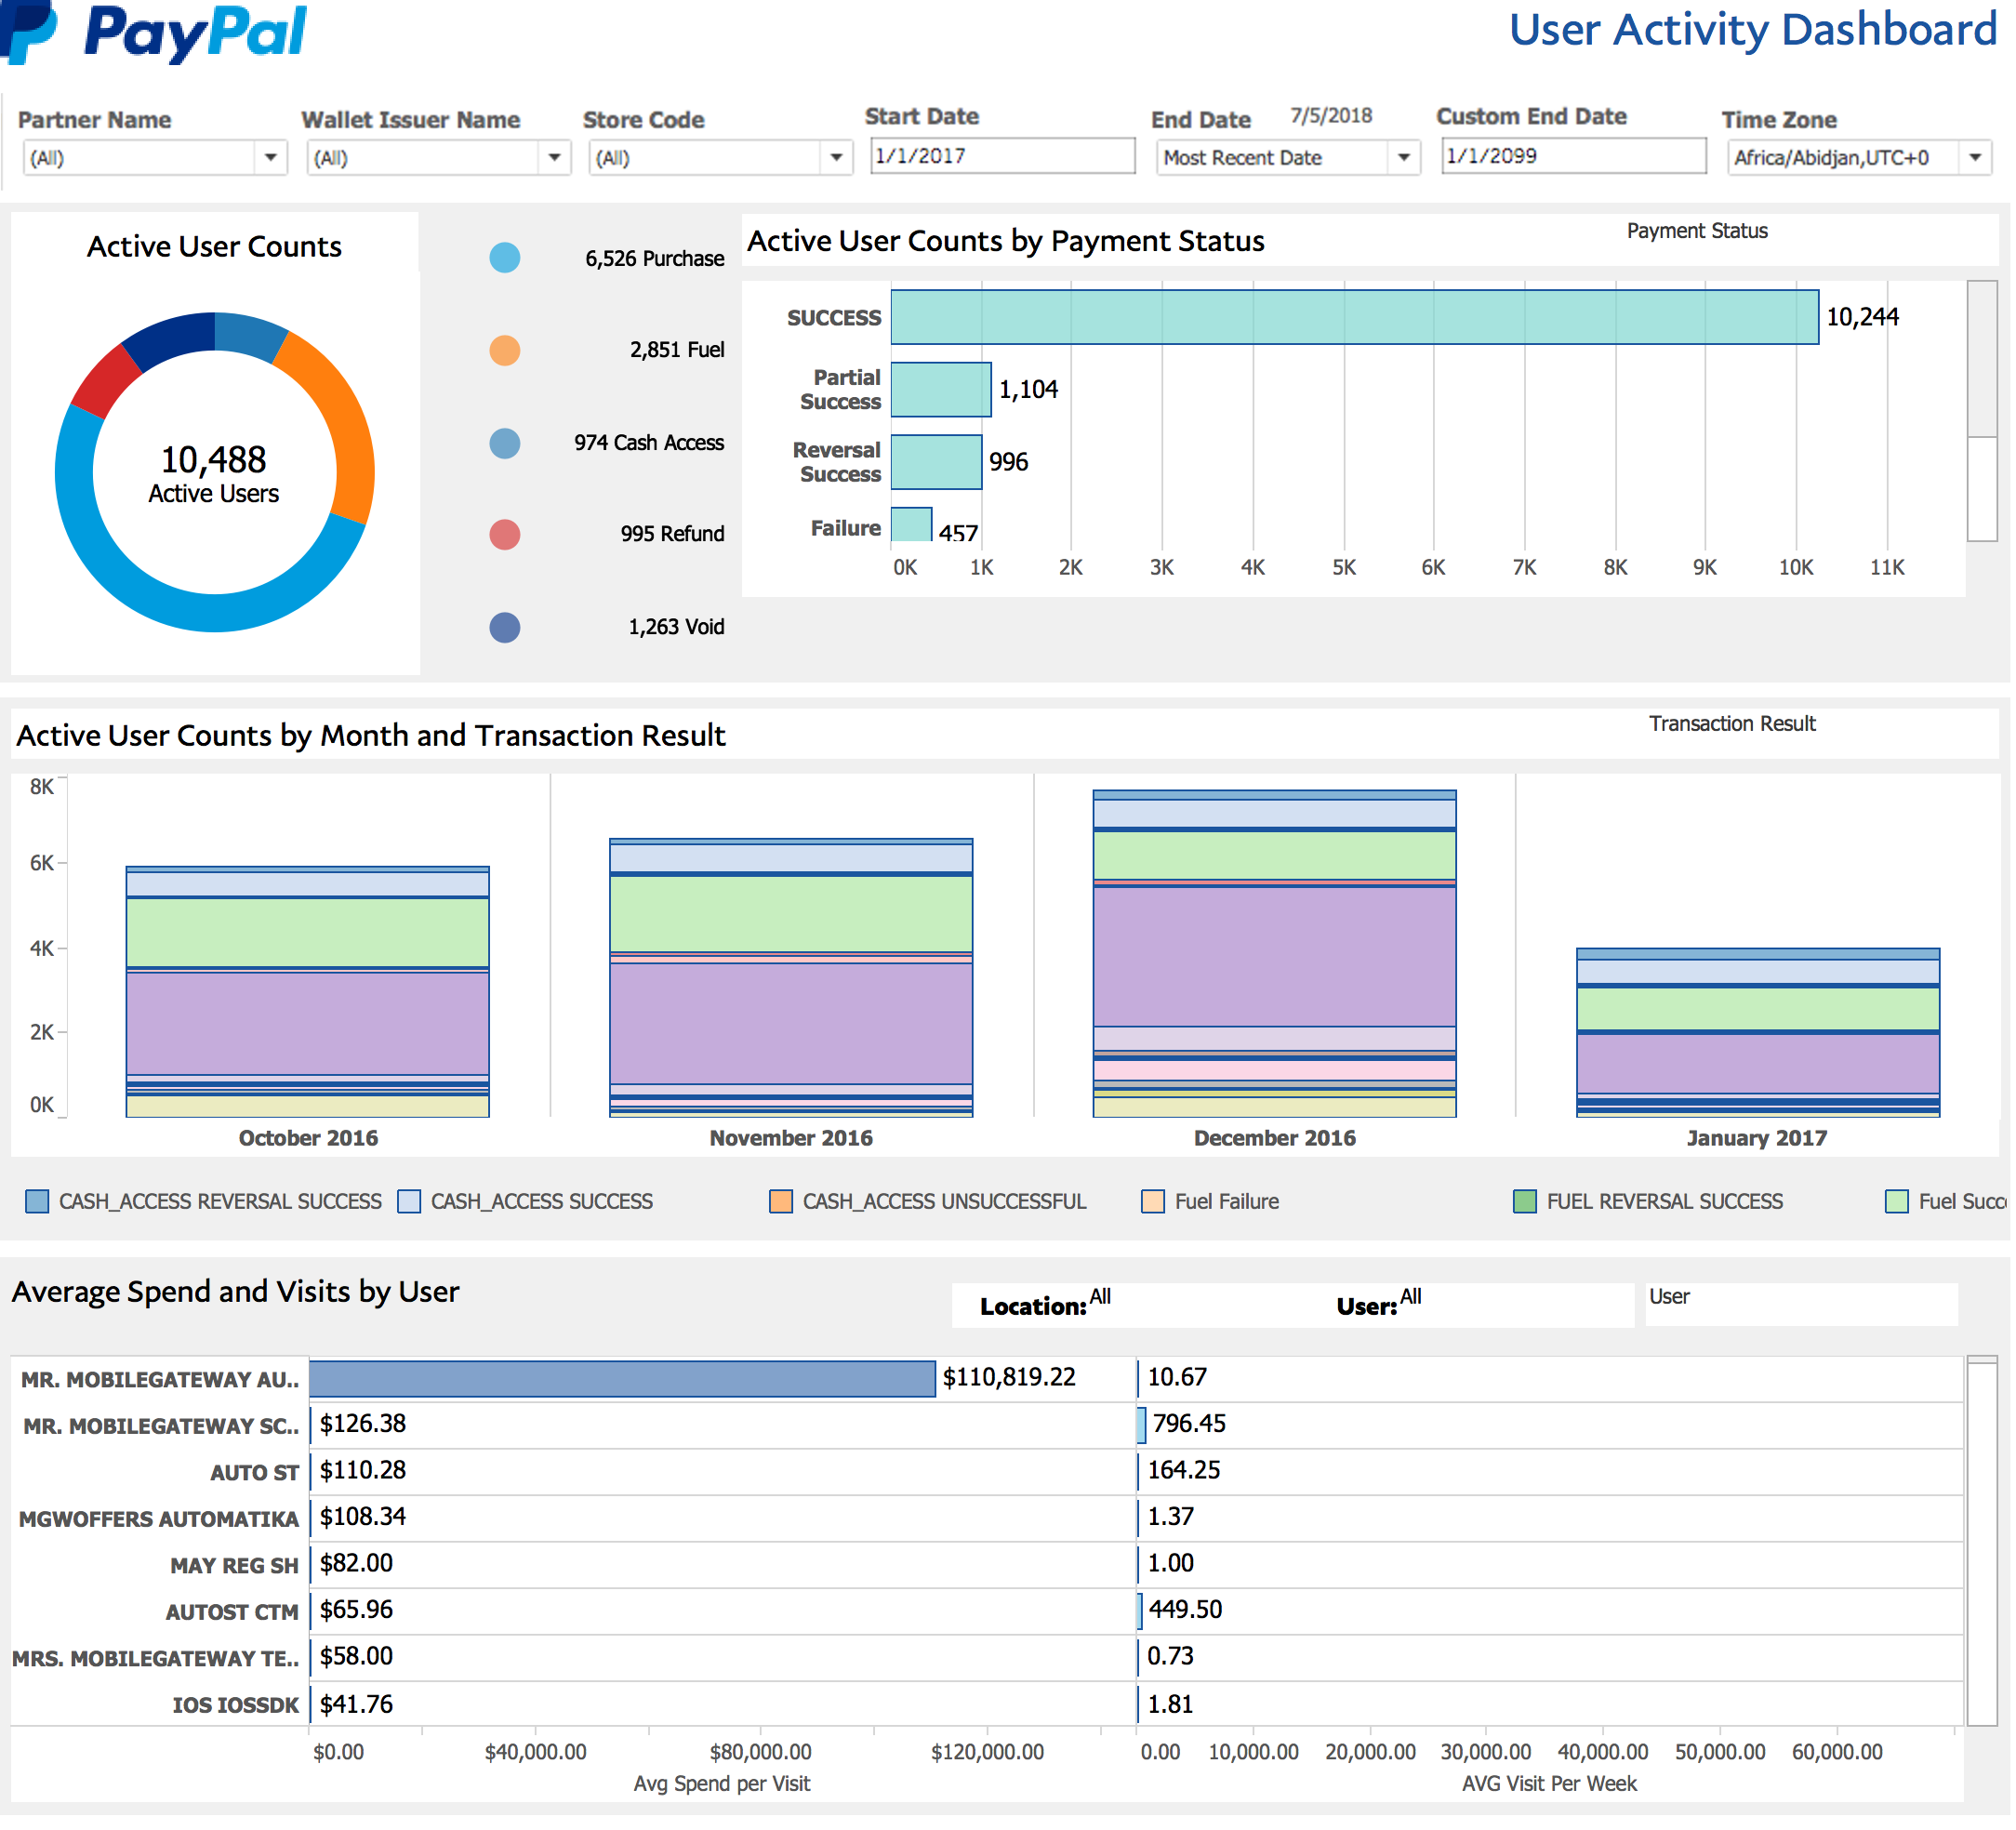
User Activity Dashboard
Provides an analysis of the individual users who have made transactions.
Update Frequency: Hourly
Key features
- Filters data by
Wallet Issuer,Date Range,Location,Store Code,Timezone, andTransaction Type. - Pie chart depicts the distribution of users and transaction types.
- Breakdown of user counts by a particular field, including
Wallet Issuer,Acceptance Partner,Acceptance Location,Device Type,Tender Type,Payment Status,Transaction Result, andFailure Reason. - Chronological bar graph of user counts over time that allows for comparisons across categories of a selected field, such as
Wallet Issuer,Acceptance Partner,Payment Status,Transaction Result, orFailure Reason. - Depicts the
Average Spend per VisitandAverage Visitors per Week, which can be further filtered byLocation,User Name,Wallet Issuer,Acceptance Partner, orAcceptance Location. - Displays local timestamps using the
Time Zonefilter (not shown in this sample).
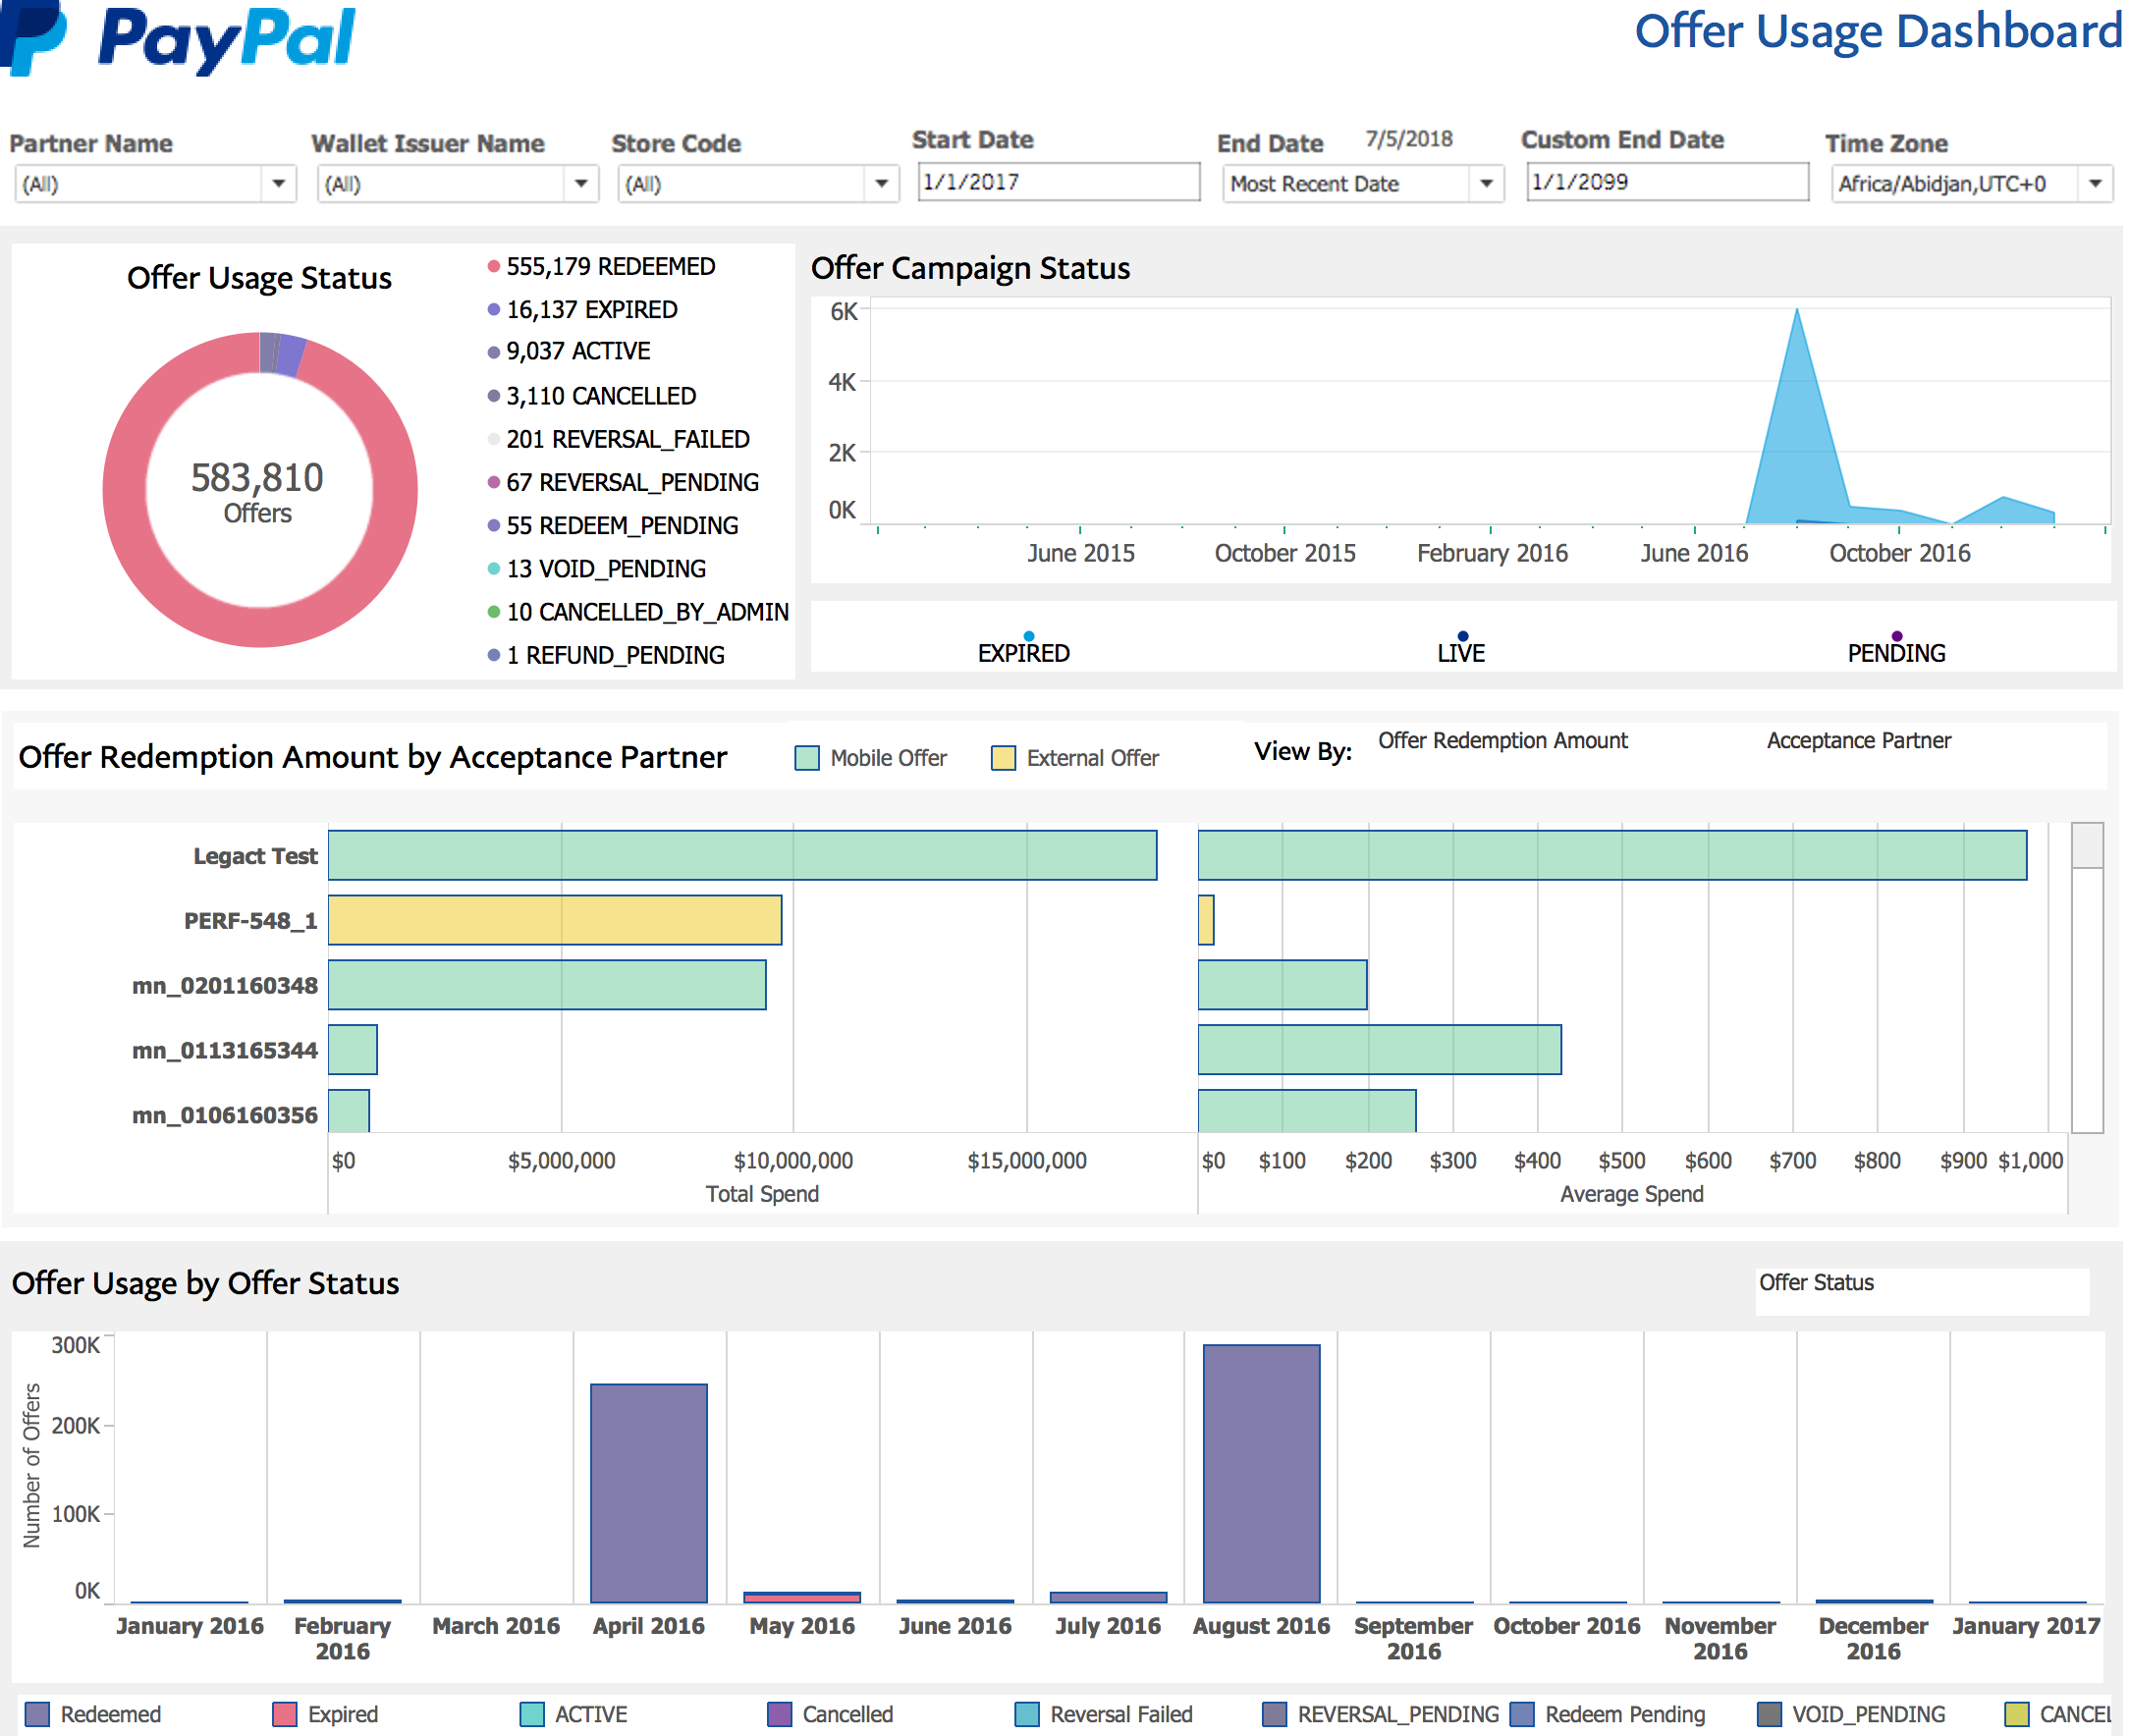
Offer Usage Dashboard
Provides merchants who implement the WLW Offers functionality with an analysis of the performance of their offer programs.
Update Frequency: Daily
Key features
- Contains information on the status of an offer, including
Active,Redeemed,Expired,Cancelled,Redeem Pending, andReversal Failed. - Filtering of data by
Wallet Issuer,Network Name,Date Range,Offer Status,Store Code, andOffer Campaign. - Depicts the relative proportions of various offer statuses.
- Depicts Offer Campaign statuses over time, which can be filtered by whether or not the campaign is expired or live.
- Breakdown of total offer redemption amount and average offer redemption amount by a selected field.
- Filters data on redeemed offers by whether they are
MobileorExternal. - Chronological bar graph of offer counts illustrates total counts over time that allows for the comparison of various categories of a selected field, such as
Offer Status,Offer Campaign,Wallet Issuer,Advertising Network,Acceptance Partner, andAcceptance Location. - Displays local timestamps using the
Time Zonefilter.
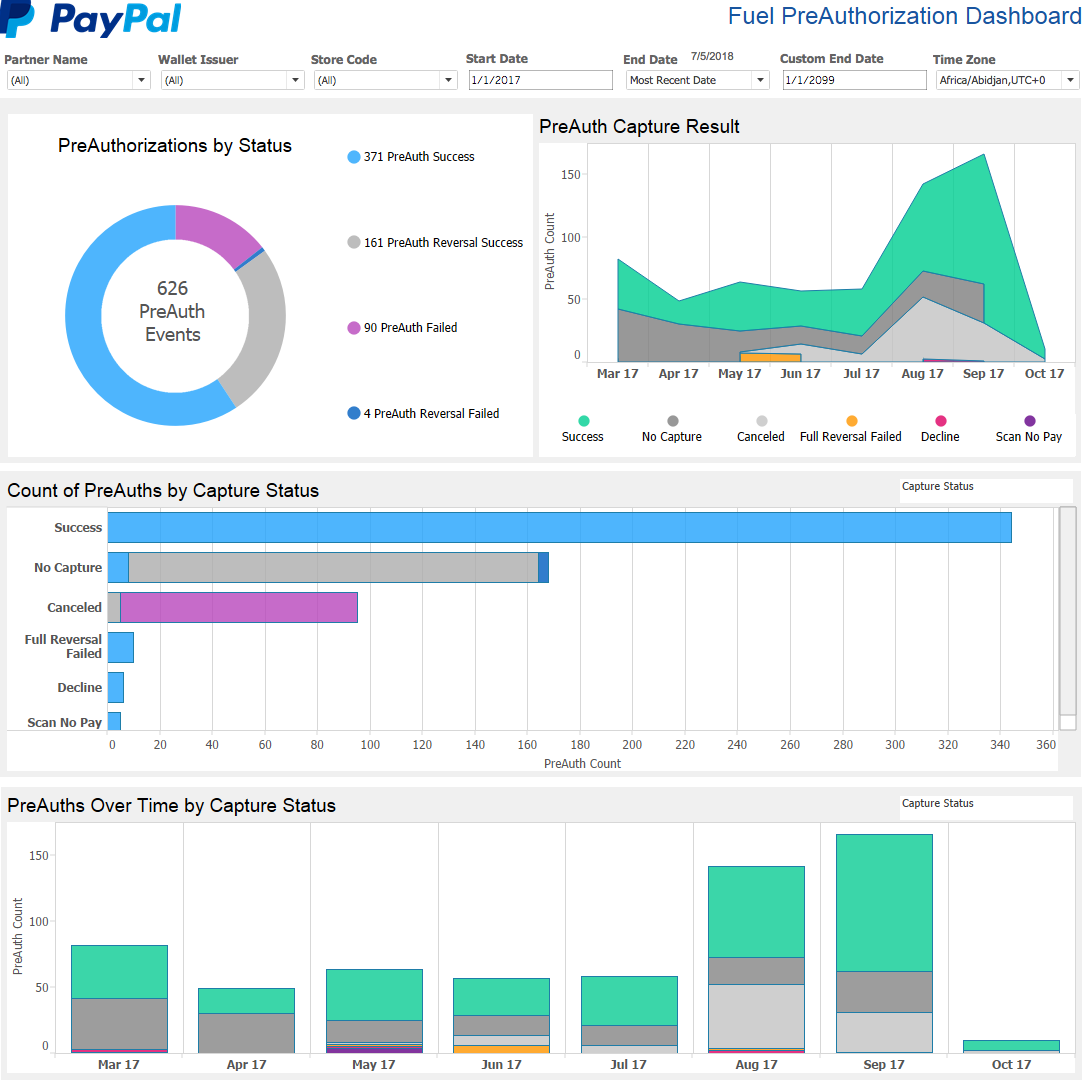
Fuel Preauthorization Dashboard
Provides fuel partners with a complete end-to-end picture of every fuel transaction, from preauthorization to payment capture.
Update Frequency: Daily
Key features
- Depicts preauth and capture counts by day, week, month or year.
- Filters transaction counts by various criteria, such as
Wallet Issuer,Acceptance Partner,Location,Capture Status,Store Code,Timezone, orTender Type. - Chronological bar graph of transaction counts that illustrate total preauth counts over time. Selecting a specific color on the chart allows the user to compare various categories of a selected field, such as
Wallet Issuer,Date Range,Location,Preauth Status,Tender Type, andCapture Result. - Ability to drill into the underlying data for any data point.
- A pie chart displays relative proportions of multiple preauth statuses, which include:
Preauth Success– the preauth was successful.Preauth Reversal Success– the preauth was successfully reversed because the processor could not be reached.Preauth Failed– the processor declined the preauth.Preauth Reversal Failed– there was an attempt to reverse the preauth, but the processor could not be reached.
- Depicts preauth counts by capture result over time. Capture results include:
Success– the preauth was successfully captured and payment was collected.Decline– the preauth resulted in a decline from the processor and payment was not collected.System Canceled– the preauth was unsuccessful due to a processor failure and the capture attempt was canceled by our platform.Full Reversal Failed– there was an attempt to reverse the capture event, but the processor could not be reached.Scan No Pay– the preauth was successful but tender information could not be collected and the payment was not processed.No Capture– the preauth was successful but there is no record of a capture attempt and payment was not collected.- Displays local timestamps using the
Time Zonefilter (not shown in this sample).