Dev Dashboard Improvements, Round Two

Feb 07, 2023
4 min read

If you happened to catch the last post about our efforts to make the PayPal Dev Dashboard better than ever, you’ve already seen some of the feature improvements and additions the team has made to meet the needs of developers. If you haven’t, I’ll shamelessly recommend you to check it out.
Now that we’re all up to speed, the Dashboard Team is back with more improvements, answers to feature requests, and updates to keep you spending your time doing, building, and iterating. With this new version, we’re bringing you a host of new features worth highlighting.
Error Count Summary Badge
One of the things we hear developers want front and center whenever they log into any kind of dashboard are key indicator stats. Are things up? Is everything functioning? What needs attention? Sure, you might be logging in to write some new code and wire in a new feature, but if you see an alert that needs attention, it can help you see what may need attention first.
To that end, we’ve got you covered.
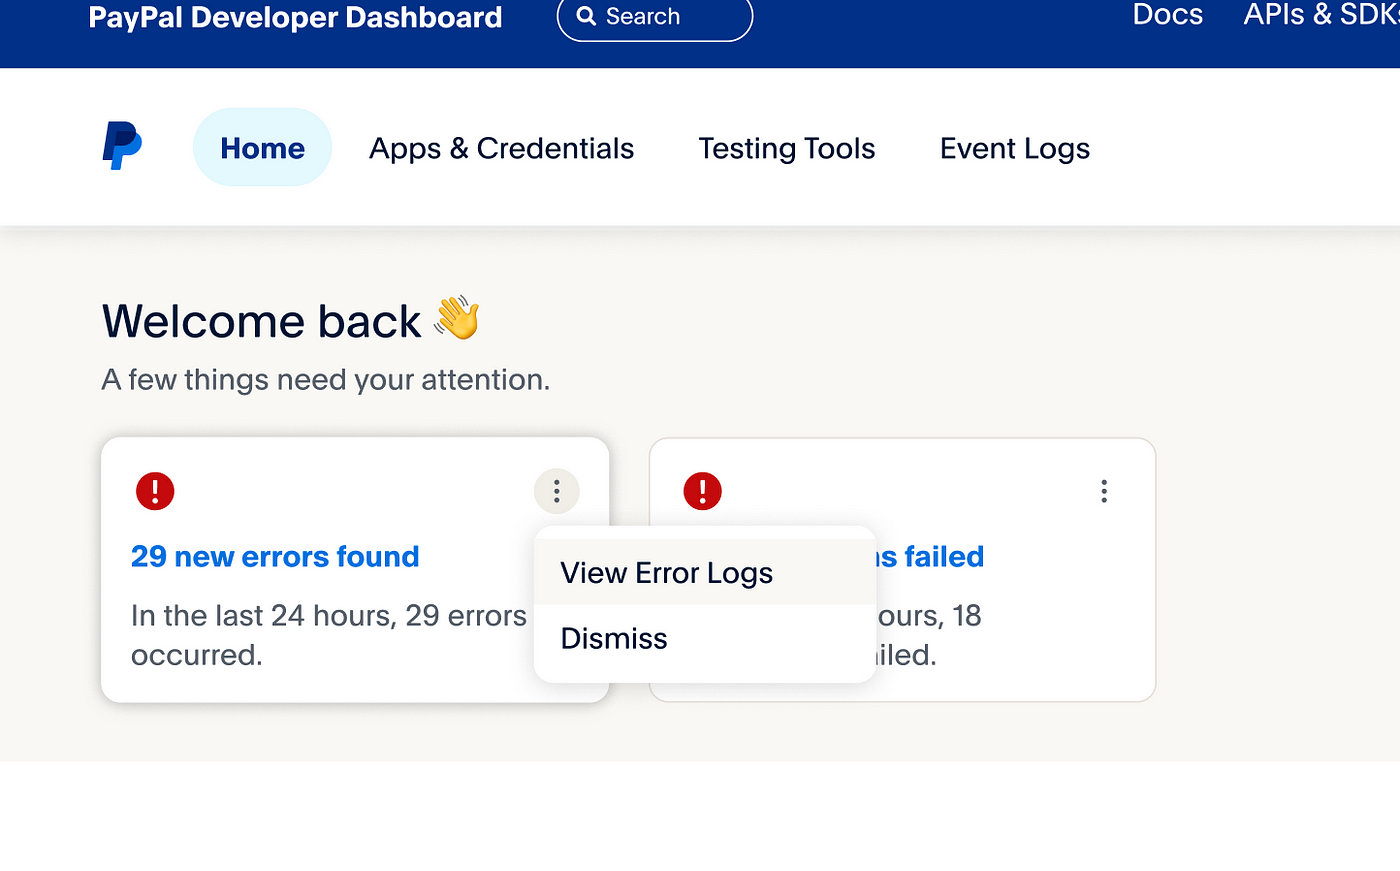
Whether you’re experiencing errors or failed transactions, we’re pushing those straight to the top where they’ll catch your eye. No more digging for status information.
With the ability to adjust the notification time window, you can decide how much you want to see. Want to see the last 24 hours? 7 days? No problem.
Now, there may be times where you might not want to keep seeing alerts for things that you’re aware of, so fortunately the function to dismiss these notifications is as easy as clicking the 3-dot menu icon at the top.
Error Log and Transactions Full Page Details
Now that you’ve got all the immediate error notifications at the top of the page, sometimes you’ll want to be able to dig deeper to find out what’s going awry. We hear you, which is why there’s an improved error log experience as well.
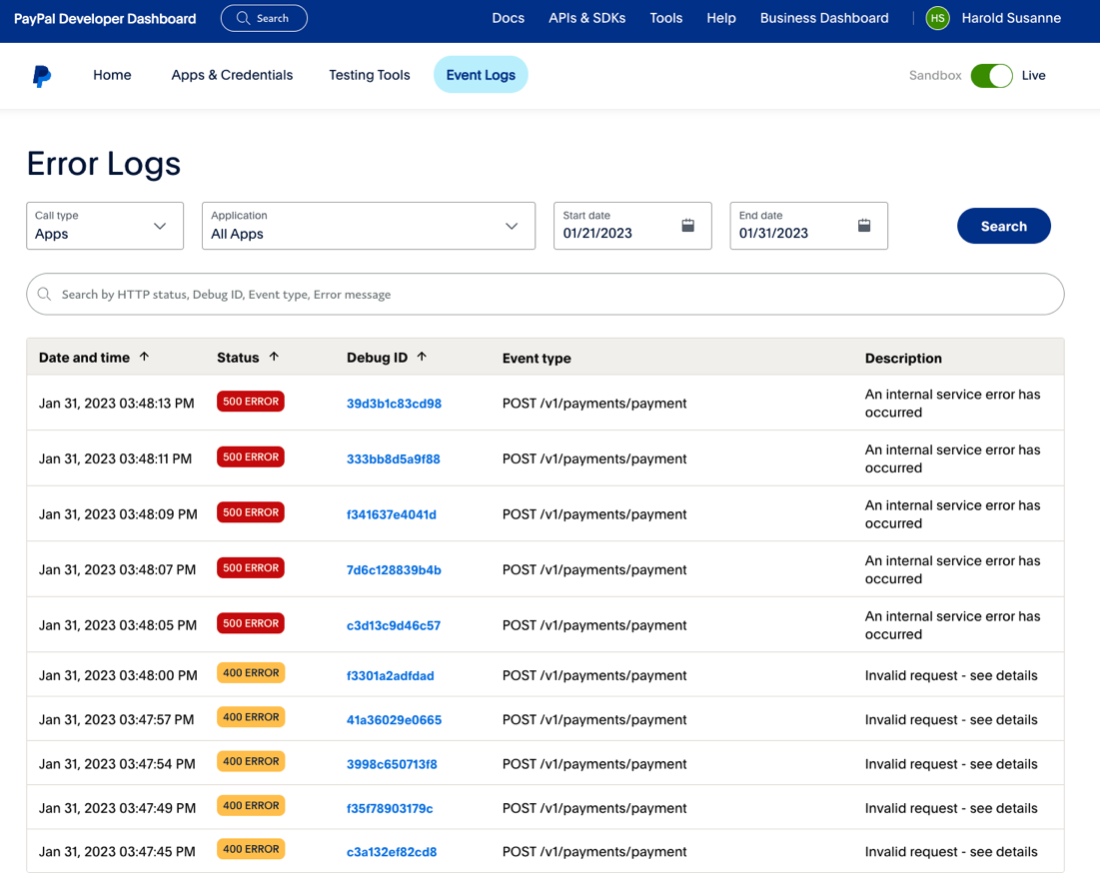
Dive into a full page of details dedicated to error logs that’ll allow you to see all errors in your integration without having to swap between API and Webhooks. While you’re there, you’ll be able to see all your 4xx, 5xx, and no success errors with plenty of info around date and time, status, debug ID, description and more.
Then, if you need more info you can search for criteria in any of the columns, as well as switch between different applications without having to navigate away. In this release you’ll get errors, followed up shortly by transactions in an incremental release.
API Detail View Redesign
Lastly, the dashboard team has put together a redesigned API detail view to put all the info you need at your fingertips. Behold and rejoice!
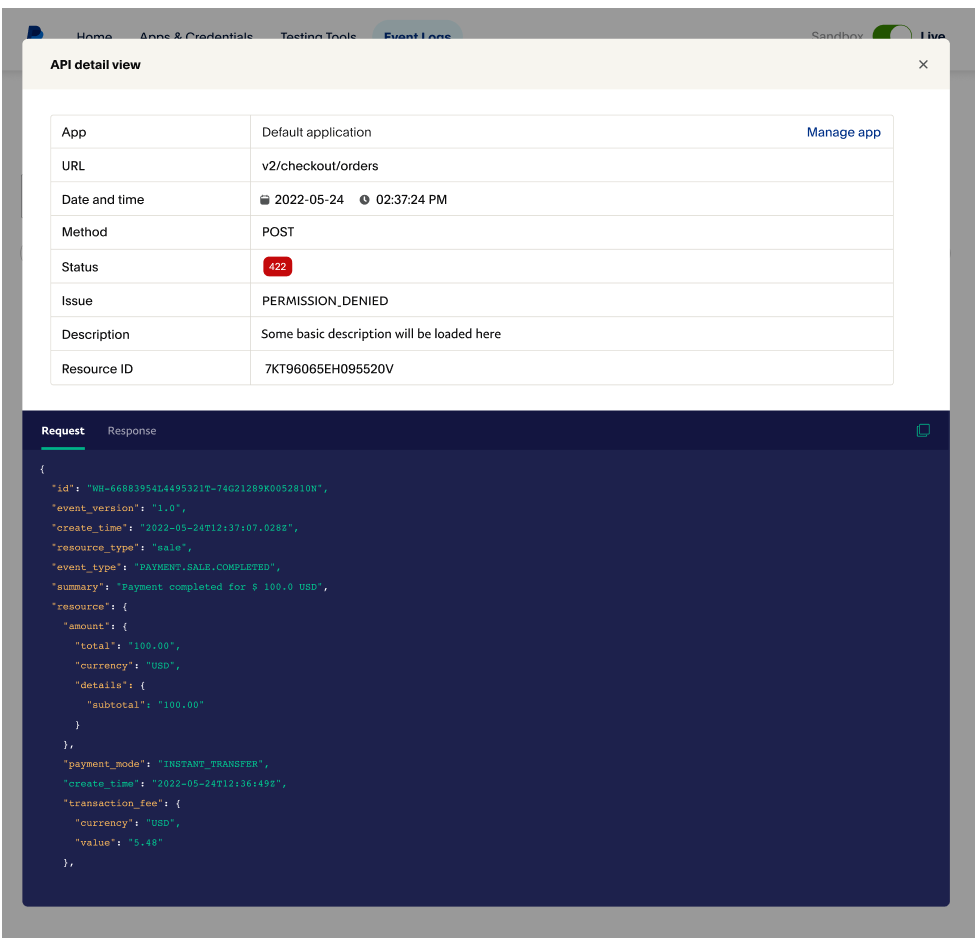
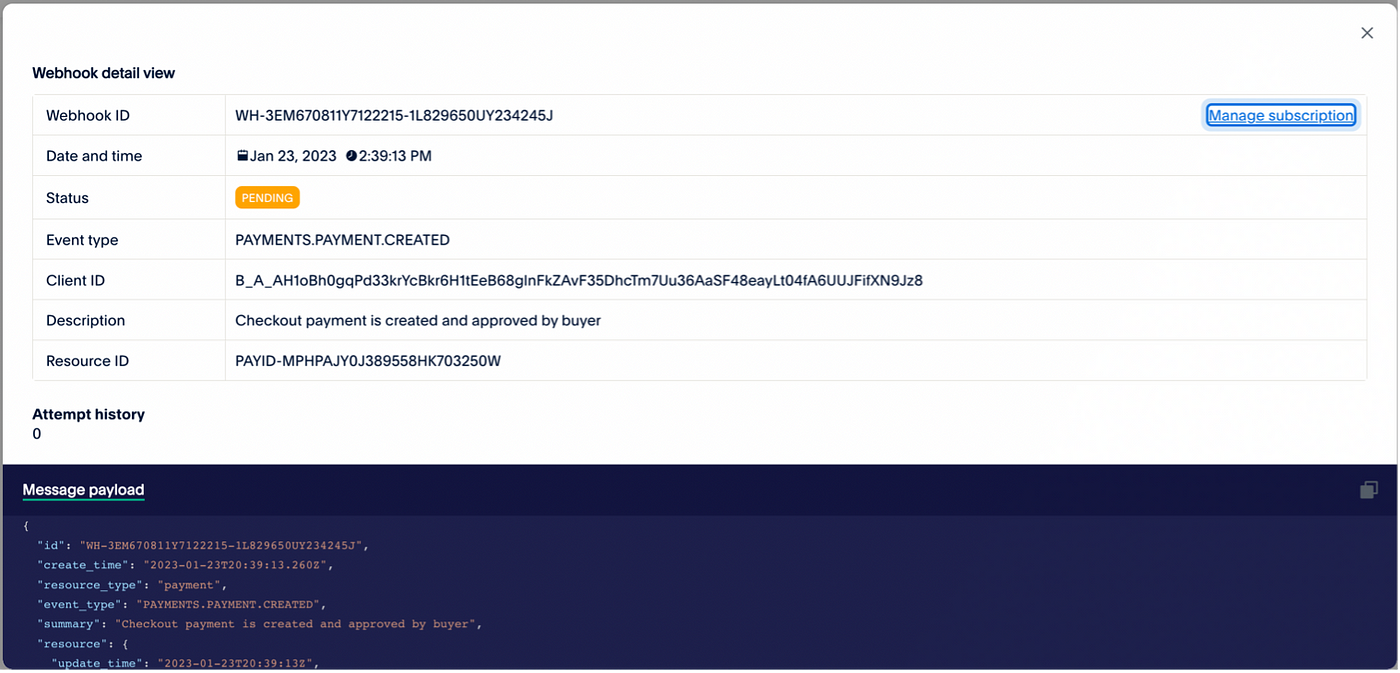
No more digging for context and details or parsing through logs for simple info. In one shot you’ll get the App name, URL, Date and Time, Method, Status, Issue, Description, Resource ID and the actual full request JSON. As a bonus, we also get the same feature for webhooks in addition to straight up APIs. That’s a pretty decent two-for-one.
As you can see, there’s a whole lot of great info packed into this release, with more to come down the road, and I’m excited I get to be a part of bringing you the good news. Now all that’s left is for you to take a test drive, so get signed up, logged in, and go for it!
Recommended
Managing Recurring Payments with Apple Pay Using PayPal
4 min read

Why You Should Attend PayPal’s Developer Meetup at Money20/20
4 min read

Building a Customizable Messaging Platform
10 min read